Recap: on Sembl / HipBone Thinking

[ cross-posted from Zenpundit — briefly picking up a strand from an earlier ZP (religio-political) post & running with it ]
.

some-of-the-fish

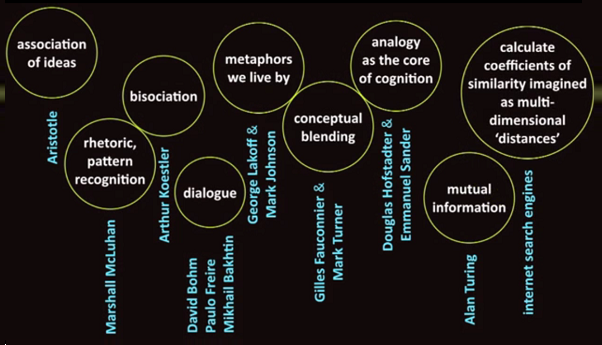
Some of the fish in the pool HipBone / Sembl swims in - slide credit Cath Styles, & h/t Derek Robinson

**

I just wanted to reiterate an Einstein quote that I slipped into the middle of a post on the Black Madonna and iconography recently, where some readers more interested in the Sembl / HipBone games and their applicability to analytic work and creative thinking may have missed it:

The words or the language, as they are written or spoken, do not seem to play any role in my mechanism of thought. The psychical entities which seem to serve as elements in thought are certain signs and more or less clear images which can be “voluntarily” reproduced and combined. There is, of course, a certain connection between those elements and relevant logical concepts. It is also clear that the desire to arrive finally at logically connected concepts is the emotional basis of this rather vague play with the above mentioned elements. But taken from a psychological viewpoint, this combinatory play seems to be the essential feature in productive thought – before there is any connection with logical construction in words or other kinds of sign, which can be communicated to others.

The above mentioned elements are, in my case, of visual and some of muscular type. Conventional words or other signs have to be sought for laboriously only in a secondary stage, when the mentioned associative play is sufficiently established and can be reproduced at will.

According to what has been said, the play with the mentioned elements is aimed to be analogous to certain logical connections one is searching for.

**

Combinatory playessential feature in productive thoughtanalogous to certain logical connections one is searching for — these three phrases sum up pretty exactly the congitive training function of the HipBone / Sembl games.

As I said earlier, I have to wonder how many of our analysts are deeply versed in this “combinatory play” of images and kinesthetic experiences, way below the threshold of conscious thought.

On the felicities of graph-based game-board design: two dazzlers

[ cross-posted from Zenpundit — completing a post that began with On the felicities of graph-based game-board design: preliminaries ]
.

Having shown you a variety of (node-and-edge) graphs in the previous part of this post

— I’d now like to turn to the issue of board game design, in particular as it applies to the HipBone and Sembl games with which I’m associated.

…..

Since the basic idea of these games is to see the links between one idea and another, graphs of this kind are the simplest and most elegant boards on which to represent game moves. Accordingly our games boards, from the simplest Hop, skip and a jump board that I’d use to introduce kids to the games —

— via my standard HipBone WaterBird board —

— to the complex and still only part-played Said Symphony board —

— and indeed beyond, to Cath Styles‘ elegant Lotus Board for the Australian Museum Game

— all our boards are graphs — and any graphs that catch my eye are potential boards, waiting for me to figure out whether they’d actually work in play, or might suggest any new ideas for board design.

…..

I therefore felt very lucky indeed one day this week, when I ran across two striking, indeed dazzling graphs in quick succession.

Artist Ellen van der Molen makes a speciality of mandalas — those circular and often highly symmetrical images, common in Hindu and Tibetan art, that Carl Jung viewed as “the psychological expression of the totality of the self” — but it was this particular one featuring “graph” imagery, which she titles Lotus Grid, that dazzled me:

There’s an interesting and delicately balanced asymmetry to the graph in this mandala, and it makes me think of board design in less tightly controlled, more flowing ways.

More of Ellen’s work can be found here [link]: my “next favorite” of her works features simple, elegant calligraphy in an unknown language — here.

…..

So that’s from the art side of the house — while on the science side I ran across this graph at about the same time.

I have snagged it from an academic paper by Andrew D. Foote et al, titled Ancient DNA reveals that bowhead whale lineages survived Late Pleistocene climate change and habitat shifts, in Nature Communications 4, Article number: 1677, doi:10.1038/ncomms2714, Figure 3: Survival of bowhead whale lineages during the Pleistocene–Holocene transition. I have removed only the words Late Pleistocene and early Holocene, which were relevant in the graph’s scientific context, but would only have been confusing in terms of my game design discussion here:

And that, my friends, is stunning for a whole other set of reasons — it suggests what a three-dimensional HipBone or Sembl game board might be like, and frankly it leaves me fumbling for ideas.

  • What might the upper (blue) and lower (green) levels signifiy, in terms of play?
  • What affordances would a 3-D board offer, that one of our simple 2-boards can’t?
  • Where can I take my thinking about graphical board design, once I have seen this, and allowed it to sink into my generative unconscious?
  • I don’t know the answers, of course. I don’t know what either of these two images will do to my own thought processes — but they’re like two pebbles dropped fortuitiously and almost simultaneously into my mirroring pool, and their ripples are surely spreading.

    My grateful thanks to both Ellen van der Molen and Andrew D. Foote and his co-authors.

    One idea leaps to another, and so the games proceed.

    On the felicities of graph-based game-board design: preliminaries

    [ cross-posted from Zenpundit — on graph theory, and the background and history of HipBone / Sembl gameboards ]
    .

    First off, a graph — at least the way I’m using it here — is a diagram of linkages. The items linked, which may be people, places, phones, ideas, quantities, whatever, are represented by dots or circles, known as nodes, and the links between them by lines, known as edges.

    Here’s a simple graph diagram with four nodes and seven edges:

    left: a simple graph, based on, right: the bridges of the city of Königsberg circa 1735

    That diagram represents — elegantly, with topological accuracy — the seven bridges connecting the banks and islands of the city of Königsberg — which gavs rise to a famous math problem, which in turn gave rise to that branch of mathematics we now know as Graph Theory.

    …..

    Graphs are thus pictures of networks, and networks are the non-linear, feedback-capable basis for an astonishing variety of interesting things such as the internet and your and my brains

    And they can get pretty complex. I’m a simple soul, and not a great network maven — but here’s what my network in LinkedIn looks like as of today. It too is a graph, although it reminds me of broccoli, or of a fish…

    Hey, that’s a pretty small network — and graph — compared with, say, a graph of all the neurons in a single brain, all the brains on the world’s computer networks, or all the neurons in all the brains on all the networks…

    …..

    Graphs with concepts at the nodes and conceptual links along the edges have been used for centuries to convey mystical states, propositions in theology, and concepts in the natural sciences:

    Left, the Sephirotic Tree in Kabbalah; middle, the four elements in Oronce Fine; right, the Christian Trinity


    …..

    So you won’t be too surprised to learn that my variants on the Glass Bead Game of Hermann Hesse, which are designed to build what he termed the “hundred-gated cathedral of Mind” by analogically connecting the great thoughts of human-kind across all the arts and scences, use graphs (in this sense) as their boards…

    Here, for instance, is one possible board design, derived from the inner vaulting of an English cathedral roof:

    …..

    Okay, past is prelude.

    In the second part of this post I’ll show you a series of boards actually used in HipBone / Sembl play, and then two dazzling works — one a work of art, the other a work of science — that leapt out at my in the course of my browsing a morning or two ago…

    Connect the Dots … see the Big Picture

    [ cross-posted from Zenpundit — bragging on Cath Styles and our joint game project, Sembl, via the Taj Mahal ]
    .

    dots and big picture

    connect the dots... ... ...and see the big picture

    …..

    Okay, I cheated: the image on the left is a modification of the image on the right using GIMP, the GNU Image Manipulation Program — but you get the idea — printed images in newspapers used to be done in halftone dots, which when magnified looked like the image on the right, and when seen from regular viewing distance like that on the left. You get my point.

    When there’s talk of “solving analytic puzzles”, though, the issue is often phrased in terms of “connecting the dots” to “see the big picture”.

    When the “dots” are nuggets of data, information, knowledge, or even god help us wisdom, however, the way to connect them for the most powerful overview is by means of a “creative leap” from one datum to the next — and such a leap, when you think of it, boils down to a primitive element of pattern recognition: this is like that, this sembles that.

    …..

    In this introductory video on Sembl, Dr Cath Styles puts what we’re up to nicely:

    Sembl from Catherine Styles on Vimeo.

    Key quote:

    Sembl generates a trove of unique analogical data, and if that data is linked to logical data about concepts, people and places, Sembl will connect our intuitive understanding of how things are like each other with our rational knowledge of what things are. We’re building a new kind of index to the global network, harnessing the associating capacity of humans and the processing power of machines. so we can surface useful, relevant information from masses of available data. It’s browse and play in the service of find and resolve…

    Let’s bullet-point that. It’s not the only way to describe Sembl, but it’s a very concise and useful one. We are:

  • generating a trove of unique analogical data
  • building a new kind of index to the global network
  • connecting our intuitive understanding with our rational knowledge
  • surfacing useful, relevant information from masses of available data
  • harnessing the associating capacity of humans and the processing power of machines
  • And we’re doing that in depth, in a style that calls forth artistry

    …..

    Isaac Bashevis Singer‘s artist’s eye sees connections that are more mystical and less obviously practical than the ones you and I see — in his short story, A Piece of Advice, for instance:

    Nowadays snow is a trifle: it falls for a day or two at most. But in those days! Often it snowed for a month without stopping! Huge snowdrifts piled up; houses were buried; and everyone had to dig their way out. Heaven and earth merged and became one. Why does the beard of an old man turn white? Such things are all related. — at night, we heard the howling of beasts . . . or perhaps it was only the sound of the wind.

    — but then Isaac Bashevis Singer has a Nobel Prize for this sort of thing — while for almost all values of you and I, you and I don’t as yet, and maybe never will.

    …..

    Here’s what an artist’s eye makes of the Taj Mahal:

    Taj_Mahal

    View of the Taj Mahal from the Yamuna River side, Ca 1810, via Art Investments & Jackson Auctions